The short answer
India's Ministry of Ports, Shipping and Waterways reported that the country's Major Ports handled 915.17 million tonnes in FY2025–26, 7.06% more than the previous year and above the 904 million-tonne target. The record is a meaningful signal of national maritime scale. It is not a container-throughput total, a service guarantee or a measure of every port's dwell time. Cargo owners should use it to test whether their own gateway plan connects terminal capacity with documents, rail or road, equipment, storage and final delivery.
The verified record is an aggregate across Major Ports
The official 5 April release contains three central figures: 915.17 million tonnes handled during FY2025–26, a target of 904 million tonnes, and year-on-year growth of 7.06%. It covers the Major Ports under the Ministry rather than every Indian port and reports cargo by weight. The Ministry attributes the result to reforms, investment, modernization and efficiency improvement. Those are the government's stated interpretations. The short public release does not provide a port-by-port or commodity table, container TEU, berth productivity, dwell time or on-time performance. VESLR therefore reads the announcement as evidence of overall scale and momentum, not proof of a specific terminal's performance. A shipper should preserve that distinction when using the figure in a board paper, route review or capacity request.
Tonnes and containers answer different questions
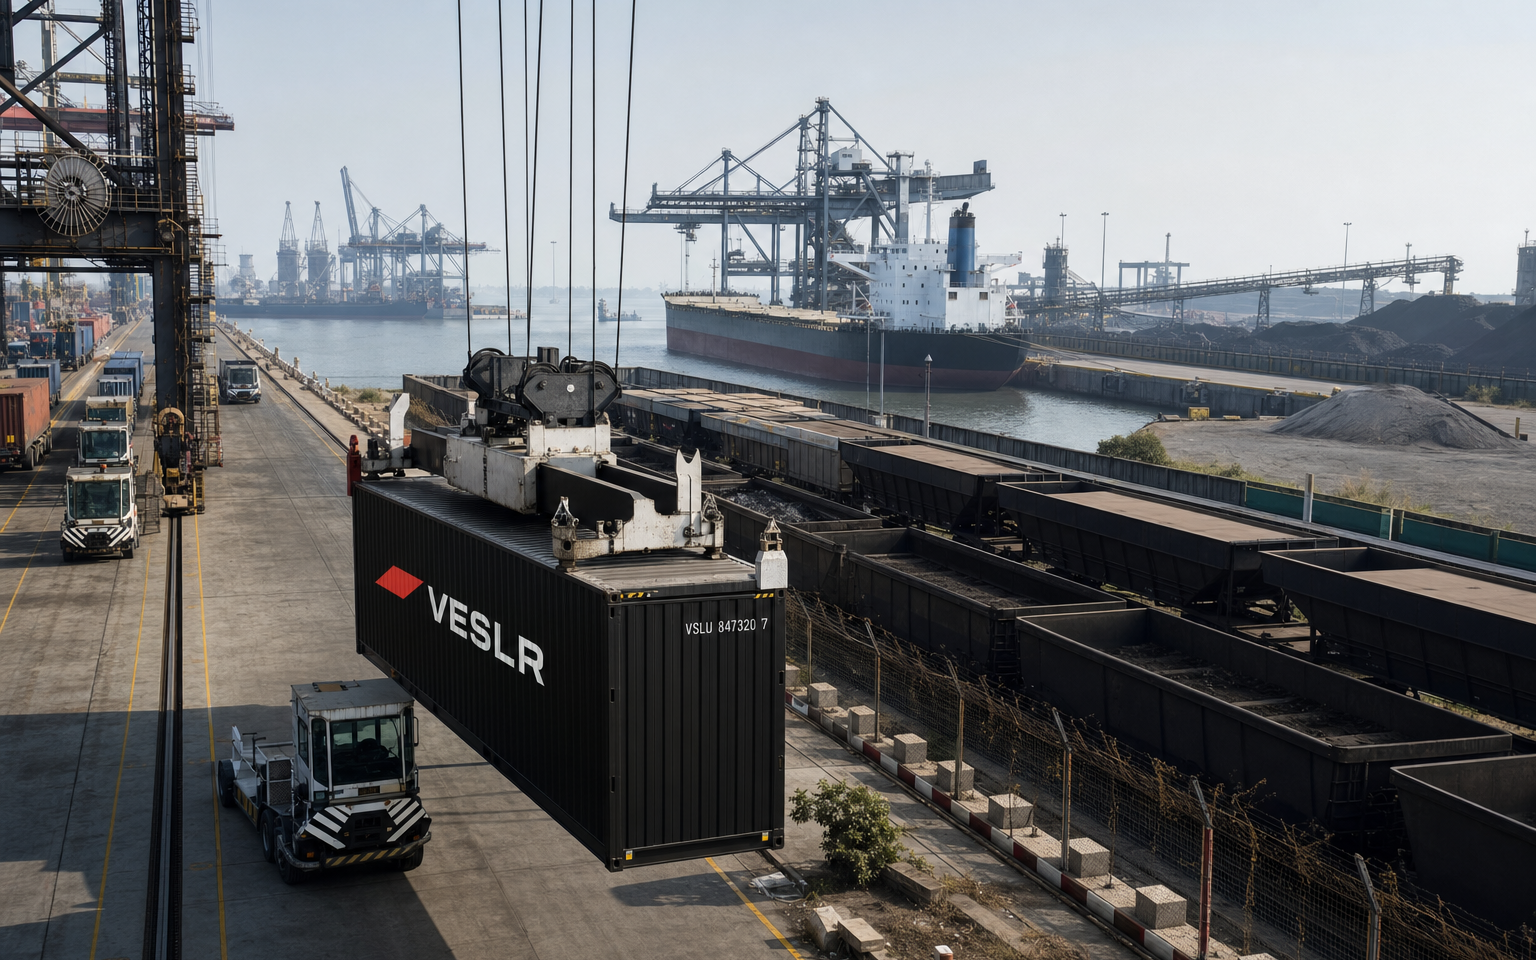
Port cargo includes dry bulk, liquid bulk, breakbulk and containerized freight, each with a different relationship between weight and infrastructure. A heavy bulk movement can add substantial tonnes without requiring container equipment; a high-volume container trade may create large yard and gate activity at a lower weight per unit. The 915.17 million-tonne total therefore cannot be converted into TEU or empty-container demand from the release alone. Container planners should use terminal and carrier data for loaded imports, loaded exports, empties, sizes and special equipment. Project-cargo teams need dimensions, lifts and berth or yard capability, not only tonnage. The national figure is valuable when it prompts these questions. It becomes misleading when used as a direct forecast for boxes, trucks or vessel slots without the missing commodity and port detail.
Usable capacity is a chain, not a quayside number
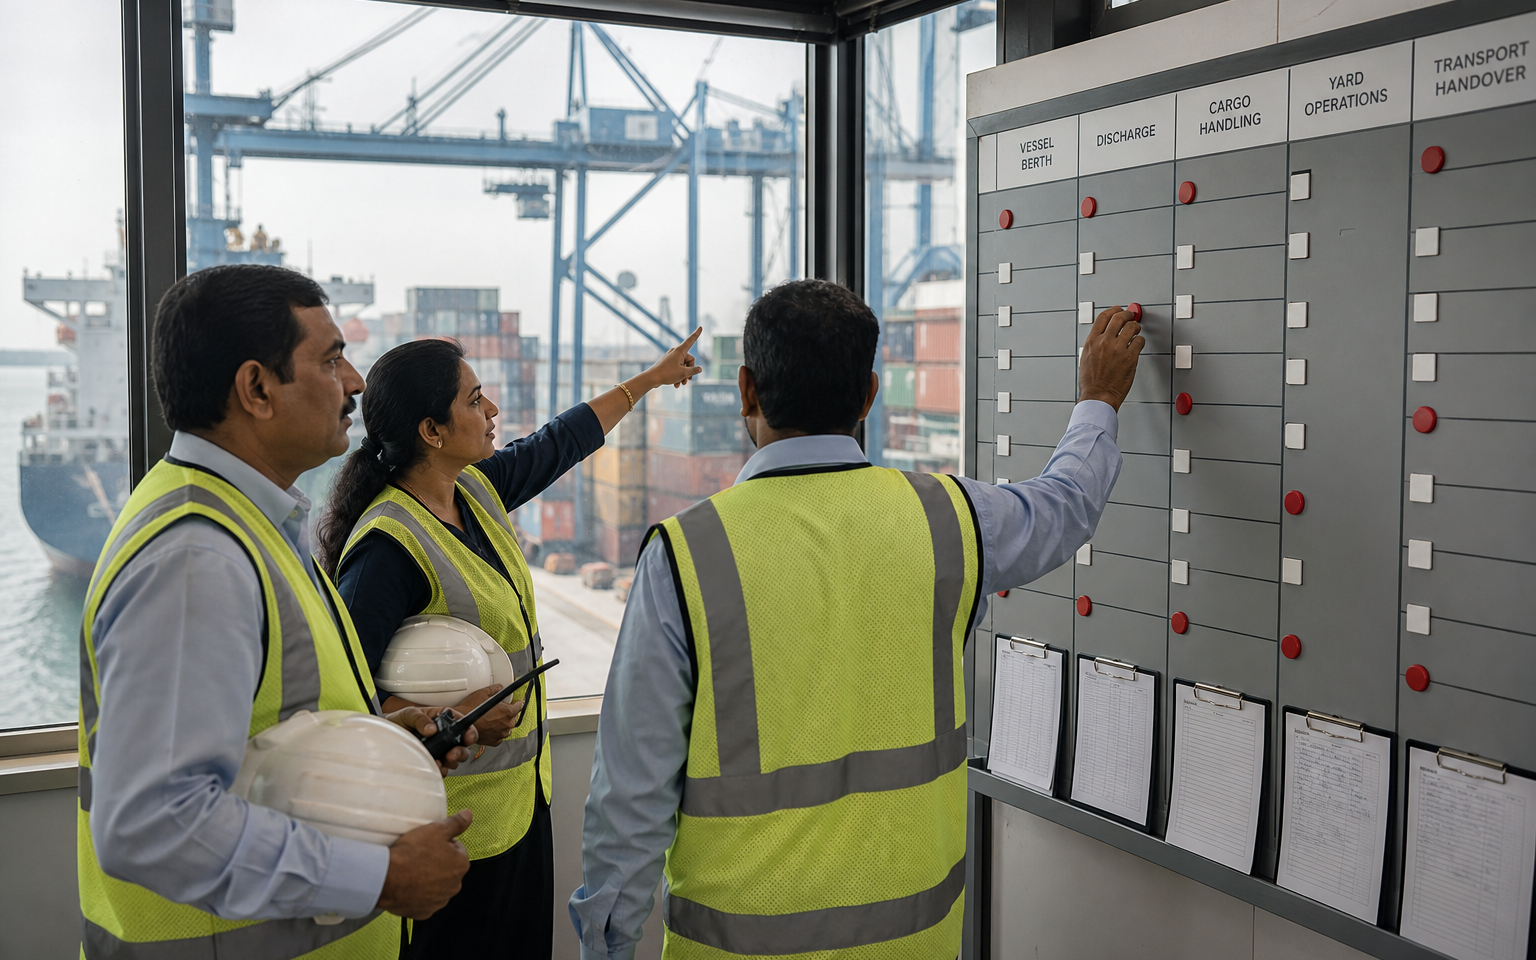
A port can handle more cargo over a year while an individual shipment still waits at another constraint. Berth windows, yard positions, customs and other documents, examinations, rail paths, trucks, depot hours, warehouse appointments and labour must connect around the same movement. Importers should map the path from vessel discharge to lawful release, final delivery and empty return. Exporters should map production completion, empty release, stuffing, verified gross mass, gate-in, document cut-off and loading. Assign one owner and evidence source to every handoff. The release's scale makes this integration more important, because growing throughput can magnify weak interfaces even when infrastructure is expanding. VESLR's inference is not that the record caused congestion; it is that aggregate growth increases the value of precise, local handoff control.
Equipment planning should follow directional flows
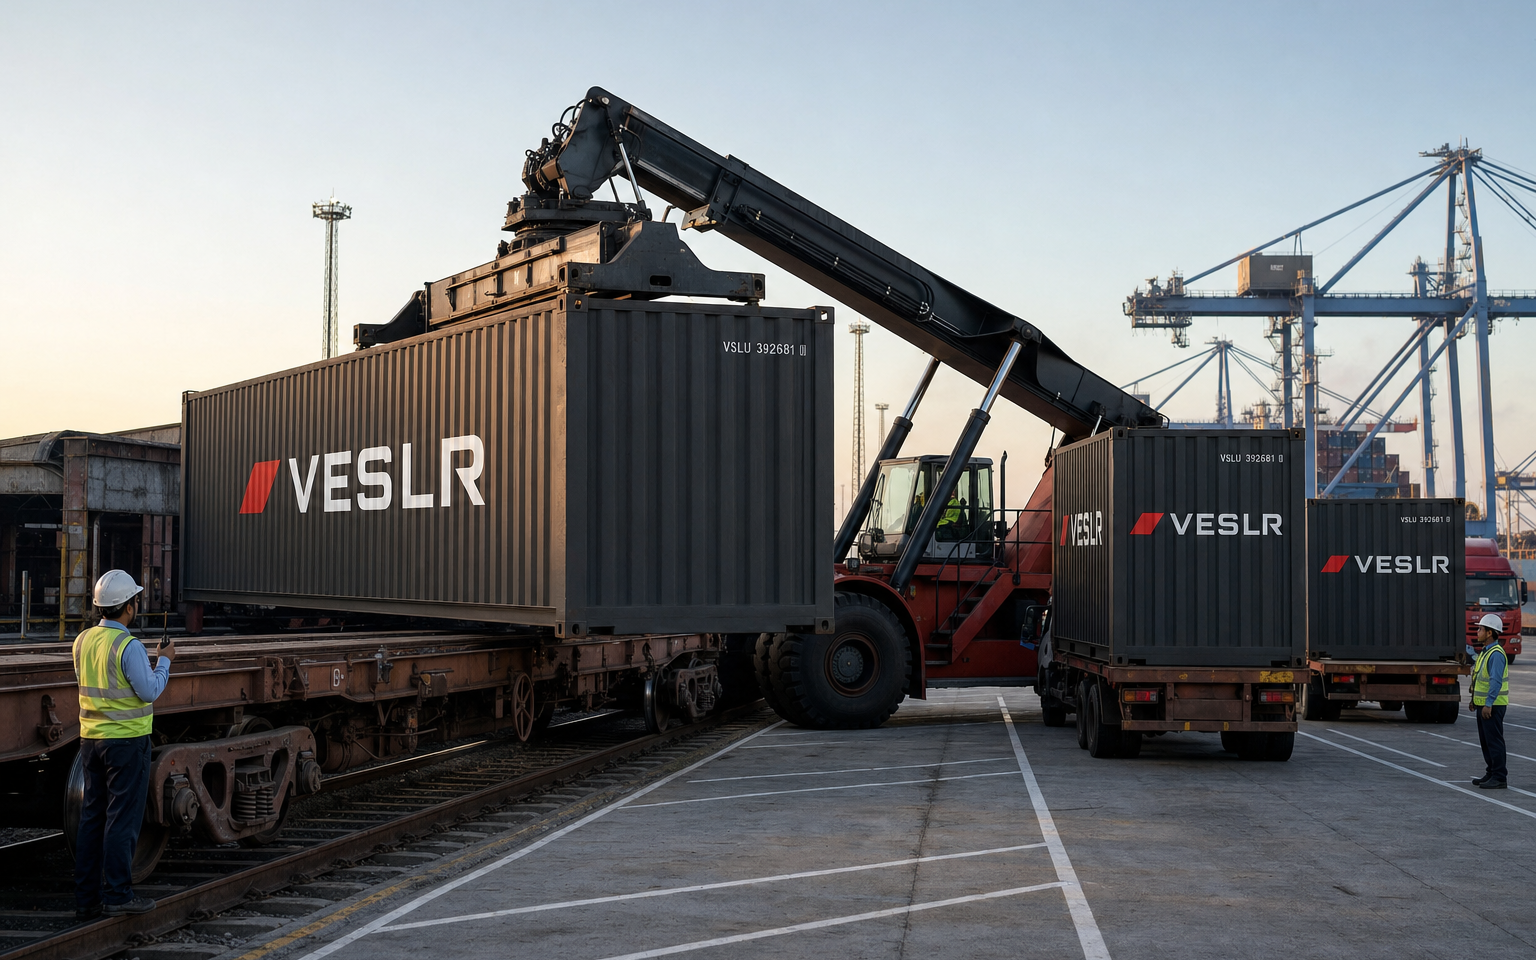
A national throughput record says little about where the right container will be available. Equipment balance is local: a port or inland depot may receive one size or type faster than exporters need it, while another location has idle stock. Build a weekly view by depot, size, type, release date, loaded direction and approved redelivery point. Include standard dry boxes, reefers and specialist equipment separately. For one-way or project leases, confirm what happens after unloading before the unit moves to origin. A strong port year can support more frequent or larger flows, but leasing decisions should still be grounded in the customer's repeatable lane and utilization window. The lowest daily rate will not repair a positioning move, missed cut-off or unapproved return location. Match the equipment network to the cargo network.
Measure reliability beside annual volume
Throughput is a scale measure. Customers also need distribution and variance: how long documents, cargo, trucks and containers take at specific milestones, and how often the result falls outside the expected range. Create a small gateway scorecard with booking acceptance, empty-release success, gate turn, vessel departure, cargo availability, customs release, delivery completion, empty return and final cost. Use definitions consistently and separate normal cycle time from exceptional holds. Do not assign every delay to the port; supplier documents, carrier changes, consignee readiness and inland capacity may be the cause. Over several shipments, the scorecard shows whether the selected gateway is dependable for the actual cargo. It also gives port, terminal, carrier and service-provider conversations a factual starting point rather than a general impression based on record national volume.
Expand only where the operating case is visible
The 7.06% year-on-year increase can encourage confidence in India's maritime trade, but a company should not turn it into a guaranteed growth assumption. Test customer orders, production, cargo readiness, booking conversion and delivered volume on each lane. Identify which constraint would bind first if the flow rose: factory dispatch, container availability, terminal cut-off, vessel space, destination clearance or final delivery. Then select an intervention sized to that constraint. It may be an earlier document review, a second trucker, a small equipment buffer or a different sailing frequency rather than a large fixed commitment. Review the result after a defined period. This keeps capacity planning proportional. The official record tells us that the system handled more cargo; the shipper's evidence must show where its next unit of capacity will create dependable customer value.
Turn a port-growth signal into a gateway review
- Keep national tonnes separate from port, commodity and container measures
- Map the full export or import handoff sequence and responsible owner
- Track equipment by depot, size, type, direction and redelivery point
- Measure shipment reliability beside annual throughput
- Identify the first constraint under higher volume
- Add capacity only where repeated lane evidence supports it